China’s coolant-line supply chain is expanding with vehicle electrification, tighter thermal controls, and demanding export quality standards. Grand View Research and MarketsandMarkets both identify automotive thermal management as a growing global market. Their reports also suggest stronger demand for reliable hoses, connectors, and fluid-circulation systems.
Yet market growth does not prove manufacturing quality. A coolant line may look clean while a silver bubble travels beneath its transparent wall. That small void can reduce coolant contact, disturb pump operation, and create local hot spots. The risk becomes greater during cold starts, pressure changes, or incomplete filling.
How to check for air bubbles in coolant lines? This question deserves more than a quick visual inspection. SAE J20 and ASTM D3306 provide useful references for hose performance and coolant compatibility, but neither standard replaces a complete bleeding and validation procedure. Supplier testing should include pressure checks, thermal cycling, flow observation, and inspection after repeated engine operation.
Cooling-system engineer Jack Rose explains, “Air in a cooling system can prevent proper circulation and cause overheating.” His practical warning is simple. Do not trust appearance alone.
For buyers comparing China’s top ten coolant-line suppliers, transparent inspection records matter. Ask for test methods, pressure ratings, material specifications, and evidence from finished assemblies. Some supplier pages sound precise, but their data may remain incomplete. That deserves scrutiny.
This guide examines practical bubble-detection methods, common supplier weaknesses, and the checks that experienced purchasing teams should perform before approval.
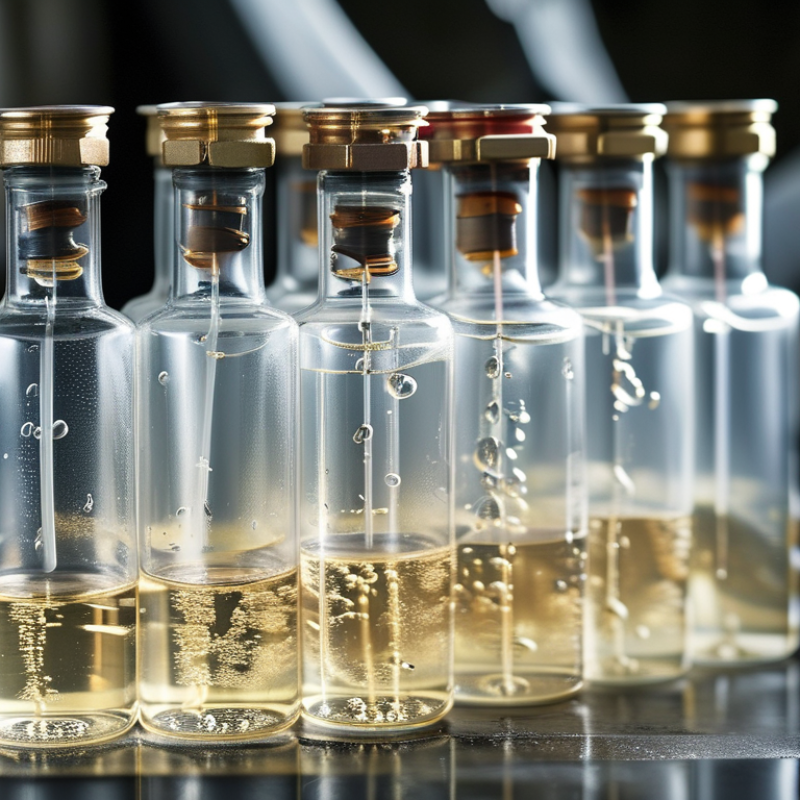
Coolant lines carry liquid between the heat source, radiator, pump, and expansion tank. In vehicles, they protect engines, inverters, and batteries from excessive heat. In industrial equipment, they support stable operating temperatures under continuous loads.
The International Energy Agency reported over 14 million electric cars sold worldwide in 2023. That growth increases demand for dependable thermal-management components.
Air bubbles are not harmless.
They interrupt liquid contact with the tube wall and reduce heat transfer. A trapped pocket can also make the pump cavitate, causing noise, vibration, and uneven flow.
The U.S. Department of Energy’s 2024 data-center energy report estimates cooling may consume 7% to 30% of facility electricity. This shows why small flow losses deserve attention.
During supplier checks, engineers should inspect hose routing, connector height, vent points, and filling procedures. Transparent test sections can reveal foam or intermittent flow.
Pressure testing helps, but it cannot replace a real bleeding test.
SAE thermal-management guidance supports checking flow stability under changing temperatures. ASTM coolant-related testing also emphasizes fluid condition and contamination control.
A practical warning: a line may look perfect outside.
It can still trap air inside. I have seen teams blame the pump too quickly. That mistake wastes time.
Supplier evaluations should record bubble behavior after cold starts, rapid acceleration, and repeated heat cycles. The test method may need improvement.
: Coolant lines move liquid between heat sources, radiators, pumps, and expansion tanks. They help control engine, battery, inverter, and equipment temperatures. Stable flow matters.
Air bubbles reduce liquid contact with the tube wall. This weakens heat transfer and can create uneven cooling. Large pockets may cause pump noise, vibration, or unstable flow.
Bubbles often gather near high bends, connectors, clamps, and narrow passages. They may hide behind curved walls. A line can look perfect outside.
Use transparent test sections during filling and circulation. Controlled lighting can reveal foam, pockets, and intermittent flow. Camera systems may measure bubble size and movement. Small bubbles remain difficult to see.
No. Pressure-decay testing mainly identifies possible leaks around joints and seals. Stable temperature is essential during testing. Pressure loss does not prove a bubble alone.
A calibrated flow bench measures coolant volume at a known pump pressure. Differential gauges compare inlet and outlet pressure. A sudden pressure drop may indicate a sharp bend, obstruction, or collapsed hose.
Heat can move trapped air into different locations. A hose may pass cold testing but restrict flow after softening. Repeat pressure and flow checks after cold and hot cycles. This extra step takes time.
Records should show coolant temperature, pressure, flow rate, test time, and fluid type. Instrument calibration should also be documented. Without these details, comparisons become opinions. That weakness is easy to overlook.
No. Combine visual checks with flow testing, pressure testing, and thermal cycling. Rotate the assembly to expose hidden bubbles. Inspecting cut samples can reveal internal defects, but it destroys the part. The method still may not represent every production unit.
Coolant lines are essential for transporting liquid between heat-generating components and cooling systems, so trapped air can reduce flow, create hot spots, increase pressure fluctuations, and weaken overall cooling performance. Air may enter during tube forming, cutting, assembly, filling, or installation when connections are not properly sealed. For this reason, reliable suppliers should control cleanliness, connection accuracy, and filling procedures from production through final inspection. How to check for air bubbles in coolant lines? Common approaches include visual inspection of transparent sections, controlled fluid filling, vacuum-assisted checks, pressure decay testing, and flow-rate comparison. Some manufacturers also use thermal imaging or ultrasonic equipment to identify abnormal circulation and hidden restrictions.
When comparing China’s top coolant line suppliers, buyers should examine whether testing is performed at multiple production stages rather than only at shipment. A strong quality program combines leak testing, dimensional checks, pressure testing, flow verification, and documented corrective actions. Suppliers that use standardized assembly procedures, trained technicians, traceable inspection records, and bubble-prevention packaging are better positioned to deliver consistent coolant line performance.

 Autowellix Autoparts